Continuum at South Beach | A 2019 Market Update
- loes
- March 8th, 2019
As we are reaching the end of the first quarter of 2019 we wanted to check in with you and show you the recent sales at Continuum in South Beach and how this relates to last year’s sales.
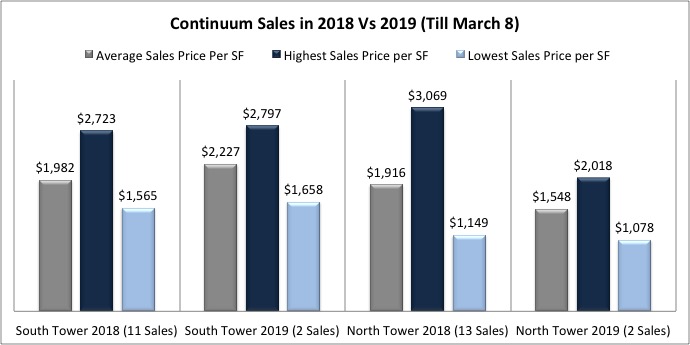
Comparing 2019 with 2018
The above table shows the Continuum South Beach sales in 2018 and the first two months in 2019. The South tower sold around 1 unit per month in 2018, and so far 2019 is seeing the same average. The sales prices also seem to be in line with 2018. The north tower also saw 2 sales in 2019 and shows the same average amount of sales as in 2018. The average sales price per SF in 2019 is staying behind as one of the two sales in 2019 was a low floor, 1 bedroom, which has lowered the average in this tower significantly.
What has Sold in Continuum South Beach in 2019?
In total there have been 4 sales at Continuum South Beach in 2019. The highest sale price per SF was paid for a 3 bedroom / 3.5 bathroom in the south tower. This 07 line sold with days for $11,2M or $2,797 per SF, while it listed for $11.6M or $2,897 per SF
The completely redone unit boasts 4,004 SF interior space, two expansive terraces with ocean & bay views and a rooftop terrace with Jacuzzi. The living room provides for 300-degree views seen through 30 floor-to-ceiling glass windows.
The lowest sales price was recorded in the north tower. Unit 612 sold for just over $1,000 per SF or $800,000. This 1 bedroom unit is located on a very low floor and looks into the townhouses. The unit was well maintained.
The other 2 sales were unit 3305 in the South Tower selling for $1,657.7 ($3.1M) and unit 1504 in the North Tower selling for $2,018 ($2.912M)
Images of unit 3007 at the South Tower which sold for $2,797 per SF in 2019
What is currently for sale at Continuum?
As per March 8 there are 41 Continuum units for sale in the South Tower and 36 units for sale in the North Tower.
In 2018, the monthly average number of sales in the south tower was 0.91 units. With 41 units for sale we see 45 months of inventory. The north tower sold on average 1,08 units per month. With 36 listings there are 33 months of inventory. The months of inventory indicate the speed of market absorption. Meaning if no other listings come in the market it would take 45 months for the market to absorb all South Tower units for sale and 33 months to absorb the inventory of the north tower.
At the end of 2018 we reported an inventory in the south and the north tower of respectively 42 and 26 months, meaning inventory went up.