Continuum South Beach is Moving!
- loes
- May 15th, 2018
The Continuum condo in South Beach is seeing more movement than in previous years. We looked at the 2018 condo sales (so no townhomes or cabanas) and we noticed that the tower is seeing an increased desirability compared to previous years. There is however a sheer difference between the south and the north tower.
Numbers were taken over the first 5.5 months of each year to compare 2018 (January till May 15) with the same period in previous years
Buyers Confidence is Back! We see more sales and higher prices per SF
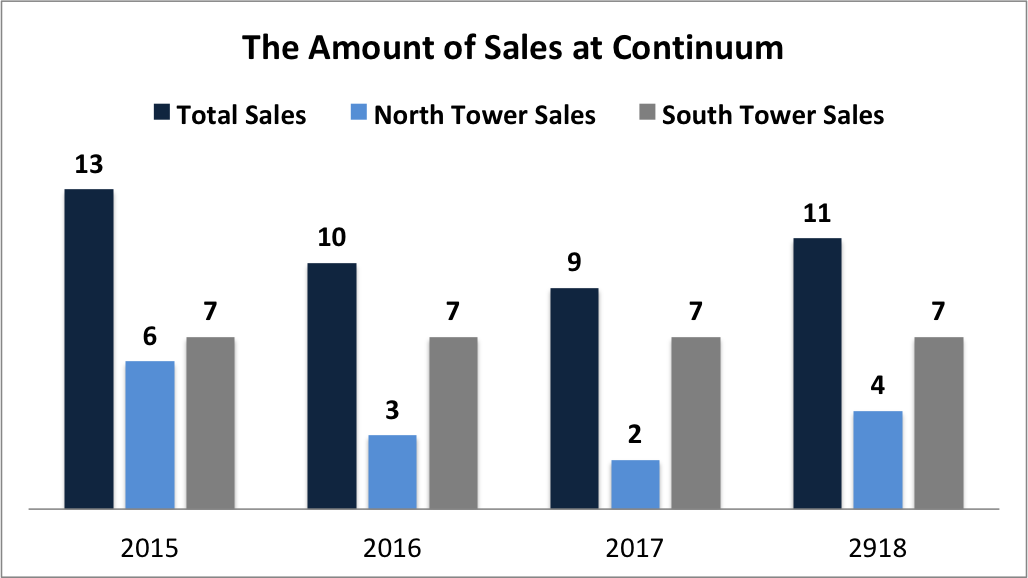
The amount of sales is increasing, as we can see from the graph below the amount of sales in 2018 (in the first 5.5 months of the year) passed the total amount of sales at Continuum in previous years. Striking is that the amount of sales in the South Tower remained 7 in the last few years, while there is more fluctuation in the north tower. Sales in the North Tower reduced significantly in ’16 and ’17 while taking up again in 2018.
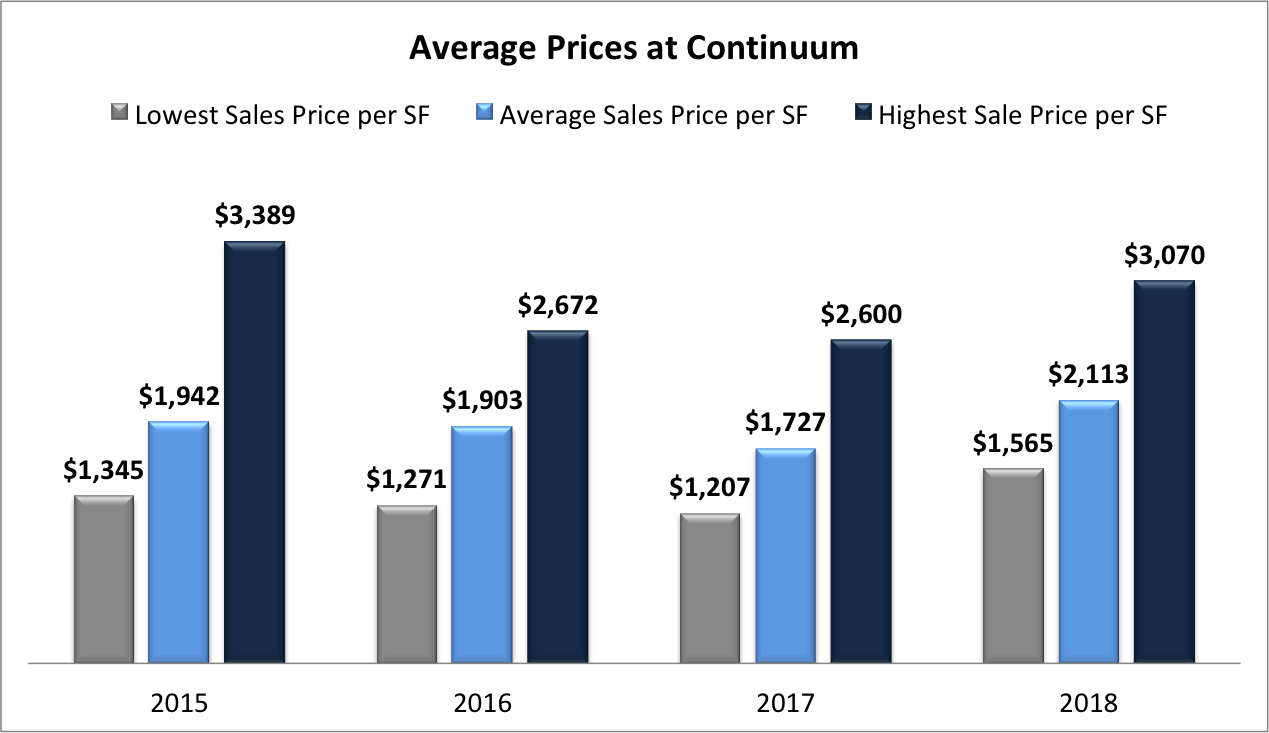
The first half year of 2018 (5.5 months really) we see a higher ‘minimum sales price per SF‘ and a higher ‘average sales price per SF‘ compared to previous years.
Numbers were taken over the first 5.5 months of each year to compare 2018 (January till May 15) with the same period in previous years
Low Inventory Levels, specially in the South Tower
Based on the sales in these first 5.5 months of the year and current listings, we can calculate* that there are:
⇒ 23 months of inventory at the south tower
⇒ 33 months of inventory at the north tower
These are both buyers markets, but the south tower is showing a soft buyers market. The luxury market is in perfect equilibrium between 12 and 18 months of inventory and the South Tower is just above that number, which is extremely low for Miami Beach luxury condos.
* example south tower: With 7 sales in 5.5 months, we see 1.27 sales per month. There are 29 current condo listings, thus 29 listings with an average of 1.27 sales per month provides you with 23 months of inventory